(Featured image: by Marco Verch, CC BY 2.0)
In a recent post I discussed why wrapping fruit and vegetables in plastic is a good thing because it slows biological decay, and therefore prolongs shelf life and minimises food waste. This turned out to be a spectacularly unpopular thing to say, and it seems that a significant number of people think that plastic waste is more important than food waste. Consequently, this post is going to try and put some numbers on the relative importance of packaging and food. How big are the environmental impacts of food production and food waste compared to those of packaging? There are obviously some trade offs here; if a particular food is very resource intensive to produce, then packaging with high environmental impacts could be regarded as reasonable in order to keep the precious resource in good condition.
I’ve written this very much in the context of our current supply and distribution system, which has to keep food fresh for weeks or even months at a time. Any keen veg grower will know that food is best eaten as soon as possible after being picked, indeed this is a major reason why many people choose to grow at least some of their own fruit and vegetables. Where we can’t do this, the second choice might be fruit and vegetables in season from a local farm shop or market. Short supply chains can allow food to be kept fresh without a lot of packaging. However, the fact remains that most of us rely on supermarkets for at least some of our fruit and veg, and if we want to eat anything out of season or food that isn’t grown in the UK it is likely to need packaging in order that the product gets to us in good condition.
In the long term, reducing the resource intensity of food production and shortening supply chains so that food didn’t need to be preserved for so long are better options, but require societal level adjustments in attitudes to food and farming. In the mean time, should we have shrink wrapped cucumbers and buy our bananas in plastic bags? In order to get some idea of this we need to think about the impacts of 4 things:
- food production
- food waste
- packaging production
- packaging waste
1) Impacts of food production
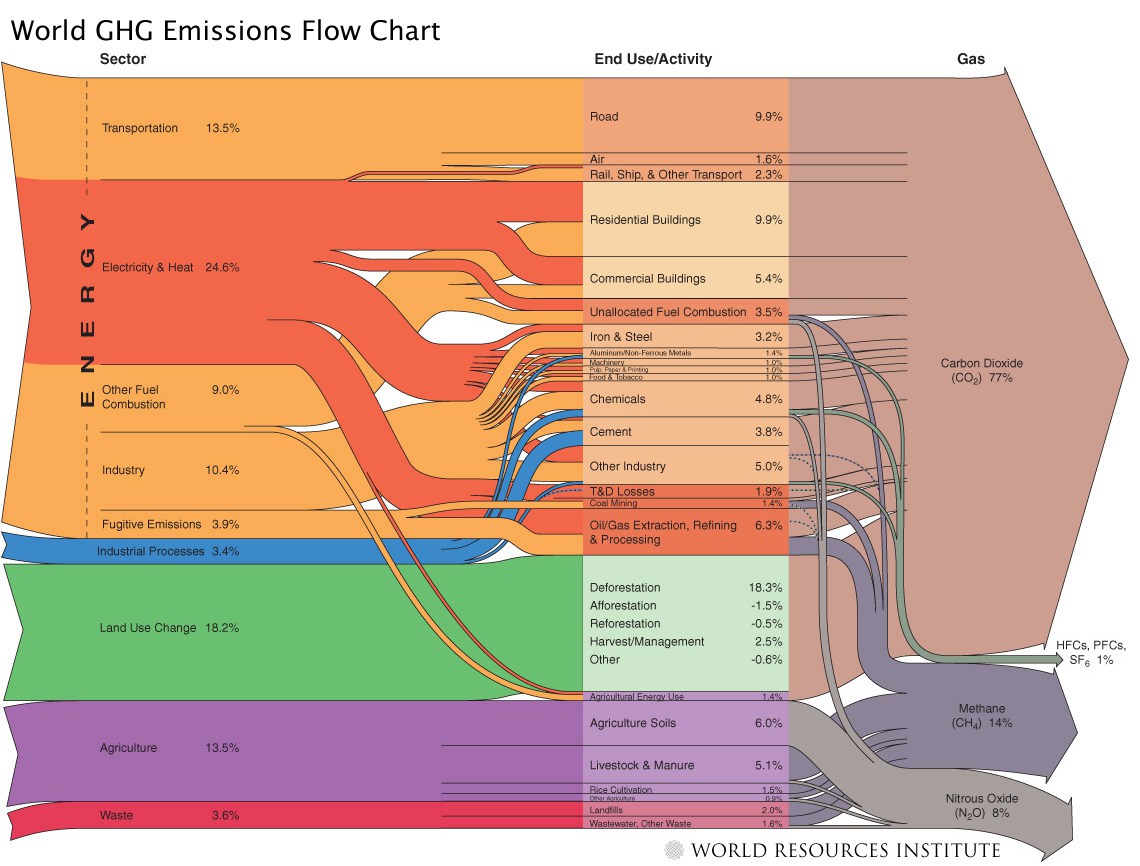
Agriculture’s total contribution to climate change depends on what you count. Directly, it contributes around 14% of total GHG emissions at a global level, with land use change contributing another 19% (this number comes from WRI, and if you’re a data geek, this source allows you to look at global emissions in all sorts of different ways). Much land use change is deforestation carried out to increase available agricultural area, so it’s not unreasonable to consider most of this 19% as part of the problem of agriculture. Agriculture’s role compared to other sectors is shown in the Sankey diagram below. These numbers from WRI are similar to estimates from other sources, which suggest 19-29% of global emissions can be attributed to agriculture (with much of the variability in estimates relating to how land use change is treated).
So if that’s the global picture, what about the UK? It’s not easy to zoom in on how these figures relate to UK consumers; we have estimates of domestic agriculture’s contribution to UK GHG emissions (around 10%), but as much of our food is imported it’s difficult to calculate the environmental impact of all the food consumed in the UK. Estimates from here suggest between 15% and 28% of total GHG emissions in developed nations. For the UK, that’s 75-140 million tonnes CO2 equivalents.
2) Food waste and its impacts
Sadly, much of the world’s food is wasted; the FAO estimate that it’s about 1/3 of total agricultural production. There is a readable report on global food waste and where it occurs in the food supply chain here. Broadly speaking, in developing nations, there is considerable loss in the upstream elements of the supply chain because of lack of infrastructure for harvesting, preserving and transporting food. In developed nations, the majority of waste is further downstream. For the purposes of this blog, we’ll limit our consideration to the EU, although you should bear in mind the potentially much higher wastage upstream in the supply chain if you’re buying food originating from futher afield.
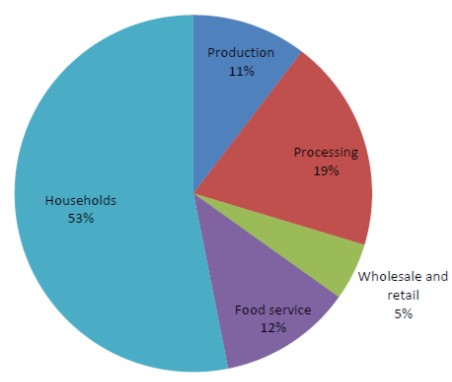
Below is a pie chart of food waste by sector in the EU. The data is from the EU-FUSIONS project, which developed a standard method for measuring and reporting food waste across all EU countries, in support of the EU’s aims to reduce food waste by 50%. As you can see, we as consumers are the biggest source of food waste, and are responsible for 53% of total food waste, whilst farmers and retailers waste surprisingly little. If you read the report, you’ll see that there is considerable uncertainty relating to waste from on farm production, where only 6 countries were able to supply reliable data. It’s also likely to be highly dependent on the type of crop, vary from one season to another, and fluctuate according to demand, so we could also argue that agricultural production is a sector where an average is not a particularly useful number.
Pie charts are great at showing relative importance, but not for showing the scale of the problem (and if the numbers for primary production are inaccurate, then this would also skew the picture above in terms of relative importance). So whilst we all like pie, it’s probably better to simply look at the actual numbers. A data table (again from EU FUSIONS) helps puts things in perspective in terms of how many kg of food are wasted per person.

From this we can see that householders throw away 92kg of food waste per person per year. This seems like a lot, so the next obvious question is how much of that is inedible (egg shells, banana peel etc)? The Waste Resource Action Programme (WRAP) have done a lot of good research on food waste in the UK, and their data on this suggests that about 22% of consumer food waste is inedible. There’s an intermediate category of possibly edible (parts that some people eat but others don’t, such as potato skins, bread crusts) that accounts for another 18% or so, but the bulk; around 60% of food that is wasted in the home is edible. And yes, collecting this data did require WRAP to comb through a lot of people’s bins. We have no particular reason to believe that the UK is much better or worse than the rest of the EU, and exactly why it is that we as consumers waste so much food is something I may come back to in a future blog. The GHG emissions arising from the 4.4 million tonnes of avoidable consumer food waste in the UK each year are estimated to be 19 million tonnes of CO2 equivalents according to WRAP (this is the same as around ¼ of private car journeys undertaken in the UK annually).
3) Impacts from packaging production
I’ve written a whole post about plastic packaging which is here. For the current discussion, we need some idea of the climate change impact of packaging. We can get a basic idea from the Sankey diagram above, which gives the impacts from chemicals as 4.8% total GHG emissions. It’s less easy to say what proportion of these chemicals would be used to create plastic packaging. But it is clearly small compared to the GHG emissions from agriculture. A much better way of looking at the problem might be to do a bottom up calculation, limiting our consideration to plastic. 40% of plastic produced in the world is used for packaging, and 50% of packaging is for food. Using figures from here (GHG emissions of around 1.5 tonnes CO2e/tonne HDPE produced) and here (3.7 million tonnes plastic used in UK/year), we could make a rough guess that the CO2 emissions associated with production of plastic packaging for food are around 1.1 million tonnes/year in the UK. I don’t think this is a particularly accurate number.
4) Impacts of plastic waste management
We’re going to limit this discussion to greenhouse gas emissions. Whilst some readers undoubtedly care passionately about marine plastic pollution (which I have written about here and here) we could just as well argue that we have missed out important impacts of agriculture; nitrification of the marine environment for example, or eutrophication. And since the original question posed was deciding on the importance of food production/waste compared to packaging, we need impacts that are applicable in both sectors, hence limiting the consideration to GHG emissions.
This report by WRAP analysed a range of life cycle assessment studies on municipal solid waste, and recycling plastic was beneficial from a GHG emission perspective in every study when compared to landfill and waste-to-energy. However, the benefits are highly sensitive to the assumptions made about how much virgin plastic production is displaced by recycling; if 1 unit of recycled plastic displaces 1 unit of virgin plastic, recycling is a good option. If the displacement falls below around 70% substitution (because the recyclate quality is too low to make a sufficiently high quality new product), then recycling was no longer justified. This is an extremely difficult problem in the UK and elsewhere; post consumer plastic is collected mixed, and significant investments in sorting equipment would be necessary to generate good quality recyclate. Perhaps this will happen, given the level of public interest in plastic at the moment.
However, if we were to take a perfect recycling scenario, a tonne of recycled plastic saves about 500kg CO2 emissions, compared to the production of a tonne of virgin plastic. Accounting for the GHG emissions of waste management is highly dependent on the assumptions made in the counterfactual; what would happen to the waste if we didn’t take a particular course of action. If we don’t recycle plastic waste we have a choice between landfilling it and incinerating it. We could argue that landfilling plastic is an excellent idea; it is a very stable material, made from fossil fuels, and so burying it in the ground is sequestering carbon. This might also give us a ‘mine’ of future material which we can extract once our processing technologies have advanced sufficiently. We could also say that incinerating plastic to create heat and electricity displaces electricity production via other means. Whether or not this has GHG emissions benefits therefore depends on what other source of electricity generation is being displaced. I might come back to this complexity in a future blog post, but in the mean time, we can use the numbers from the WRAP report that indicate around 0.1 tonnes CO2 emissions from landfilling 1 tonne of plastic.
The final reckoning…
We now have the following numbers for the four impacts we were originally interested in when we were thinking about the relative importance of food and packaging.

This are plenty of flaws in how I got to these numbers, and it’s also an average situation. But hopefully it will be clear that overall, the GHG emission impacts of agriculture are at least 100 times higher than the impacts of the packaging we use to keep food products fresh. So we should remember that food is precious and minimise our purchase of food we don’t then end up eating. We should also ensure that it is kept in such a way as to ensure it doesn’t go off before we eat it. In most cases this means packaging and keeping it in the fridge, as discussed in a previous blog post here. If you want to read about why in most cases the best packaging material is plastic, the blog post is here.
Averages – always wrong but often useful
As I’ve pointed out, I’m not confident in the accuracy of the numbers calculated above, but since the magnitude of the difference between agriculture and packaging is around 100, perhaps we can take them as indicative of an overall picture.
The issue of GHG emissions from food and what it’s packaged in has also been studied directly for individual foodstuffs (including for packaging materials other than plastic), including by a group at the University of Michigan. If you’re interested in the detail, two key reports are here and here, and yet more details are available via this website. For the current discussion, two summary diagrams are worth highlighting. The first one emphasises the overall carbon footprint of food, and how small a part packaging plays in this.

If you’ve read my blog post on what a low carbon diet might look like (here) this data isn’t very surprising; meat production (particularly beef and lamb) has very high GHG emissions. Consequently, the GHG impacts of anything that the meat is packaged in are going to be very small in comparison. Whilst this data only covers impacts up to the point of use (i.e. the impacts of food you throw in the bin isn’t included), it obviously follows that it’s particularly important not to waste foods with high carbon footprints (or just stop eating them).
The second stacked bar chart (below) includes impacts across the entire life cycle, and is based on data from the US.

The pale blue part of the stacked bar is food production and processing. Spinach is the only product for which packaging was significant, and you’ll note that the packaging type (PET clamshell) is not what’s generally used in the UK (where ready to eat bags are more common) so it’s not clear how applicable this finding is. The pale green part of the bar is packaging production, and is not a high proportion for most foodstuffs. Similarly, the proportion of emissions from packaging waste disposal (the dark green part of the bar) is invisibly small for most food stuffs; from a GHG emission perspective, what you do with plastic waste is insignificant. The dark blue part of the stacked bar (edible food waste disposal) reiterates the significance of food waste which we looked at earlier.
Bear in mind that because the total impact of each food stuff has been normalised (i.e. the bars are all the same height) the potential for misinterpretation arises; even though packaging is a significant part of the impact of spinach, if you are a meat eater, spinach packaging is trivial. Please dwell on that point for a moment if you eat meat (and I am a meat eater myself). The value above each bar is its total GHG emissions per kg of product if you want to be reminded of the relative impacts of different foodstuffs, and go back to my blogpost on low carbon diets if you want to understand this aspect better..
Final thoughts
Food production makes up a significant proportion of global GHG emissions. Plastic packaging doesn’t. Even if we are more concerned with waste management than climate change, food waste is still far more signficant than plastic waste. We cannot expect to eat fruit and veg that is out of season in the UK and/or not grown here at all and simultaneously not want it to be packaged like the precious commodity it is. We also need to stop buying food we don’t eat.
I find it both depressing and fascinating that I ended up feeling I needed to write this post. Depressing because despite the overwhelming maths, our society seems to be obsessed with drinking straws, plastic bags and disposable coffee cups, rather than what is undoubtably the biggest environmental challenge we have ever faced, namely GHG emissions. Fascinating, because I really don’t understand how we got ourselves into this mess.

Good thinking!
LikeLike
Great article, really very nice – I will be refering people to it!
Often overlooked in the concern about climate change per se is the ecological damage (habitat destruction, insect population damage) that in turn result in emissions. Even if energy production went green tomorrow, population growth, and more crucially consumer demand, will continue to demand the conversion (ie destruction!) Of land into agricultural production. I have litttle doubt that green energy is at hand, but whether or not we can learn to curb our appetites for other things seems much more uncertain . Agricultural choices really are the key to climate change issues and the survival or human civilisation.
LikeLike
If you eat meat bought from a supermarket or other mass supplier, presumably? Different (or not?) if you raise your own?
LikeLike
Difficult question! There are some uncomfortable economies of scale with meat production, and also a conflict between welfare and climate efficiency (intensive farming has lower emissions but less good for welfare). Important thing is not to eat beef or lamb. Perhaps read the post on “what does a low carbon diet look like ” if you haven’t already.
LikeLike
Thank you for your interesting and clearly well researched posts. My home town has aspirations to go “Plastic Free” and the impetus being the “Attenborough” effect and have signed up to SAS’ campaign. I went to an open public meeting and during the meeting I became frustrated about the discussions on plastic bags, toothbrushes etc. Due to my 20+ years working in waste management, waste minimisation and environment protection I felt offering to volunteer I could perhaps influence thinking on this. My views on circular economy and reducing consumption carbon footprint and the fact that I won’t demonize plastic don’t seem to sit well with the rigid structure of this campaign! It is depressing but if I can stop one idea which has been muted getting logo jute bags made for the town without proper consideration of production impact it will be worth the frustration.
LikeLike
It’s interesting that so much food is wasted now, when it is already wrapped in plastic. Can we assume it would go up dramatically if that food were transported not wrapped in plastic? My (very un-scientific) observations are:
1) a lot of household-level food waste is due to busy lifestyles (if calling people disorganised is too judgemental) – I was shocked to look inside the fridge of one of my eco-minded friends and see how much food in there had rotted simply because he’d forgotten about it!
2) keeping fresh produce in plastic in the fridge locks in condensation and speeds up spoilage – the easy solution ofc would be to have the food transported in plastic if it must travel a long time, but then take it out of the plastic once you get home. Is it just me who does this?
I’m not saying I think household food waste would go down enough to compensate for increased transport waste if food wasn’t plastic-wrapped – I don’t think it would – I just see these stats about how much longer food lasts in plastic, and the stats on food waste, and the conclusion that plastic reduces food waste, which I don’t think is that simple. My disorganised friend would forget he’d bought a cucumber whether it was shrink-wrapped or not. I don’t think we disagree actually, being organised and reducing food waste is more important than going ‘plastic-free’. I’m just being contrary. 🙂
LikeLike
Hi Susan, some good points there.
1) busy lifestyles etc. Yes, I suspect you’re right. Food doesn’t have the same priority and social aspect that it perhaps used to. There is a school of thought that suggests that shopping for an individual meal (i.e. little and often, and only what you need) wastes much less than doing the ‘weekly shop’. There is certainly a trend towards smaller more regular shopping trips in the uk. In practice i don’t think this would decrease waste; I suspect it would increase the opportunities for impulse buys!
Fridges are really badly designed; they’re not very well insulated, and then as you say there is the issue of stuff getting left in the back. You can imagine a shallower fridge making it more difficult to lose stuff in the back working well for example. Redesigning the lighting in fridges might also help.
I think the ‘at what point in the supply chain should the food be packaged and how’ issue is a really interesting one. There’s issues of physical protection from damage (e.g. plastic punnets for grapes), and the issue of biological protection and protection from contamination. I think for some products (grapes being an obvious one), waste would go up a lot without protective packaging. Protecting from spoilage (decay) is best done in plastic because it’s impermeable so it makes it much easier to control the air composition around it. There may well be products that could be packaged less in transit, but since the environmental impact of the packaging is so small compared to that of the food, is it worth the risk?
Since a very small amount of total food waste is in the supply chain, I don’t think this is where we should be focussing.
The condensation issue is an interesting one; the ideal situation is to store the product in it’s packaging in the same conditions it was in at the supermarket. As you probably realise, air holds different amounts of water at different temperatures, so it’s entirely possible with some of the perforated packaging that a product which had no condensation in it when it was in the supermarket, rapidly develops condensation on it’s journey to your home. In this instance, removing packaging is probably a good idea. However, as I’ve alluded to in a few of the related blog posts, many products will keep better if you leave them in the packaging (unless it accidentally filled with condensation on the way home).
I agree that the idea that plastic decreases food waste is not always going to be true, but I think if we look at losses related to the supply chain in some of the countries of origin of these foods, we see plenty of examples of how important packaging is (in lower income countries, most of the waste is in the supply chain and not in the home).
WRAP have just released a new report on household food waste, and I am also about to do a ‘2 year update’ blog post, which will incorporate some of the findings and other material that has come out recently.
thank you for your comments and best wishes, Judith
LikeLiked by 1 person
Thank you for such a speedy and detailed reply, and apologies for not returning the courtesy.
I wonder if it’s just that home fridges don’t control temperature/humidity as closely as in supermarkets, or is food not that sensitive…
But yes, it probably is a small effect; I’m totally with you on plastic packaging being needed in the supply chain.
LikeLike
Funnily enough i did put some temperature probes in my fridge for a bit last year to see what the fluctuations were like. Main finding was that it was around 2 degrees cooler nearer the bottom, which adds another variable to how to decide where to put things!
On the subject of humidity, I think you’re right. Air holds very little moisture at low temperatures (i.e. the water condenses out), and the number of air changes in supermarket fridges is much higher. This is a bad thing from an energy perpsective, but probably decreases the risk of condensation quite a lot (which in turn reduces the risk of food spoilage…).
LikeLiked by 1 person